As part of my archive planning, I’ve been doing a series of visualizations to both test out my code and to get a sense of scale of the archive. Usenet was notorious for its prodigious amount of posts, which Gene Spafford so memorably characterized as the “herd of performing elephants with diarrhea.” In terms of the archives I’m working with, the post counts (as you can see below) number between 50,000 to 100,000 and above, though it’s important to note that there’s significant amounts of cross-posting (so posts appearing in multiple newsgroups). However, there’s still a large amount of newsgroup-unique data, and so the visualizations offer a sense of scale outside just raw numbers.
I’ve you can view the ones I’ve done so far at my Tableau page, and in some cases I have commentary below (if the visualization fails to represent unique issues with the specific data). For the modules used to make these visualizations, see the GitHub repository.
Poster Activity
One of the most notable things about when Usenet was the sheer volume of readers it had at (roughly) its peak. As Marc Smith put it, the “invisible crowd” of readers for any given newsgroup vastly outnumbered the amount of active posters (1999). However, there was a core groups of frequent posters, which is clearly apparent from the treemaps below. These are done using the email address in the “From” line, so highly active users who frequently switched addresses aren’t as visible here. To see the number of posts for an email address, just select the box. In order to prevent inadvertent outing, I’ve also not included emails in the tooltips, as some individuals did get access to and post in these groups via “official” university or employer emails connected to their legal names.
Cross-Posting Between Newsgroups
These bubble graphs track what newsgroups posts were being made to. To make these graphs, I scraped the post ID and associated newsgroup addresses from the archive, alphabetized the newsgroup lists (in order to get the total numbers), and collected them in a CSV. The numbers that appear when you mouse over is that total number of posts in that archive–so, posts made to multiple newsgroups might appear multiple times or overlap. The archives are also inconsistent in what’s held in them. Posts that were originally cross-posted and held in one newsgroup archive might not be in the other newsgroup archives.
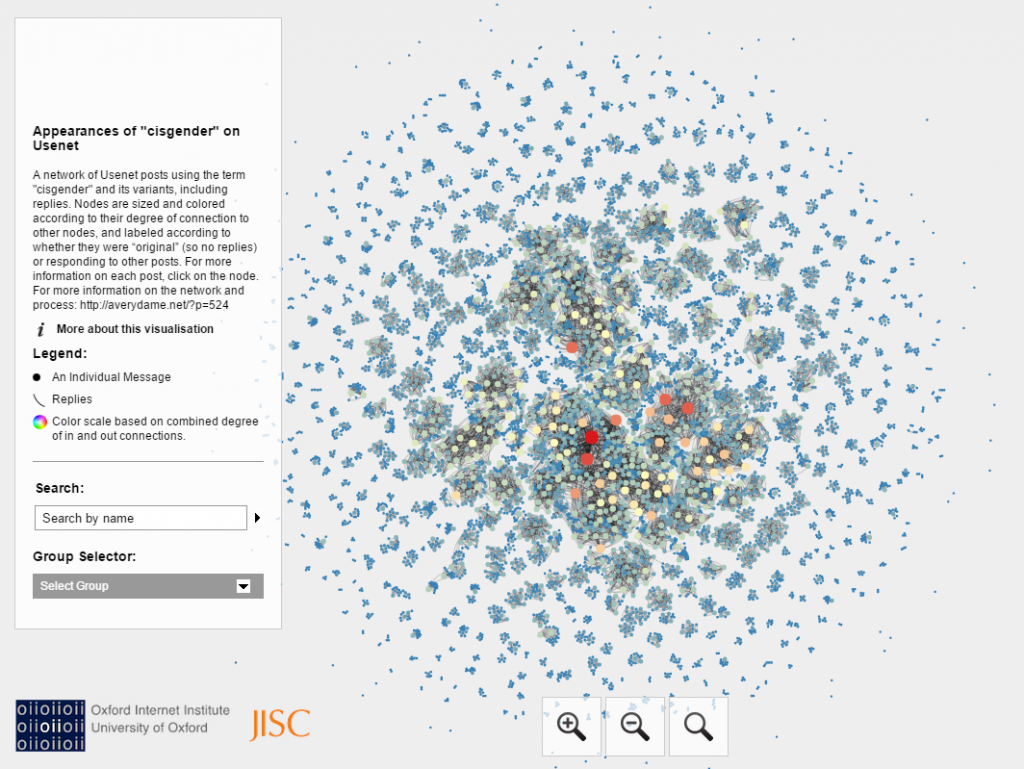
Social Network Analysis: Appearances of “Cisgender”
For more detail on this process and findings, see my post Visualizing Poster Activity on Usenet.
Citations
Smith, Marc. 1999. “Invisible Crowds in Cyberspace: Measuring and Mapping the Social Structure
of USENET.” In Communities in Cyberspace, edited by Marc A. Smith and Peter Kollock,
195-217. London; Routledge.